Gene Expression Data Explorer
Enter gene symbol:
Description
Select conditions below to toggle them from the plot:
| GROUP | CONDITION | SAMPLES |
|---|---|---|
| Infection |
GSM5448989 GSM5448990
|
|
|
GSM5448987 GSM5448988
|
||
|
GSM5448986
|
||
|
GSM5448991 GSM5448993
|
Homo sapiens
GSE180044
PBMC
Select conditions:
Control Condition
Perturbation Condition
Differential Gene Expression Analysis
Select differential expression analysis method:
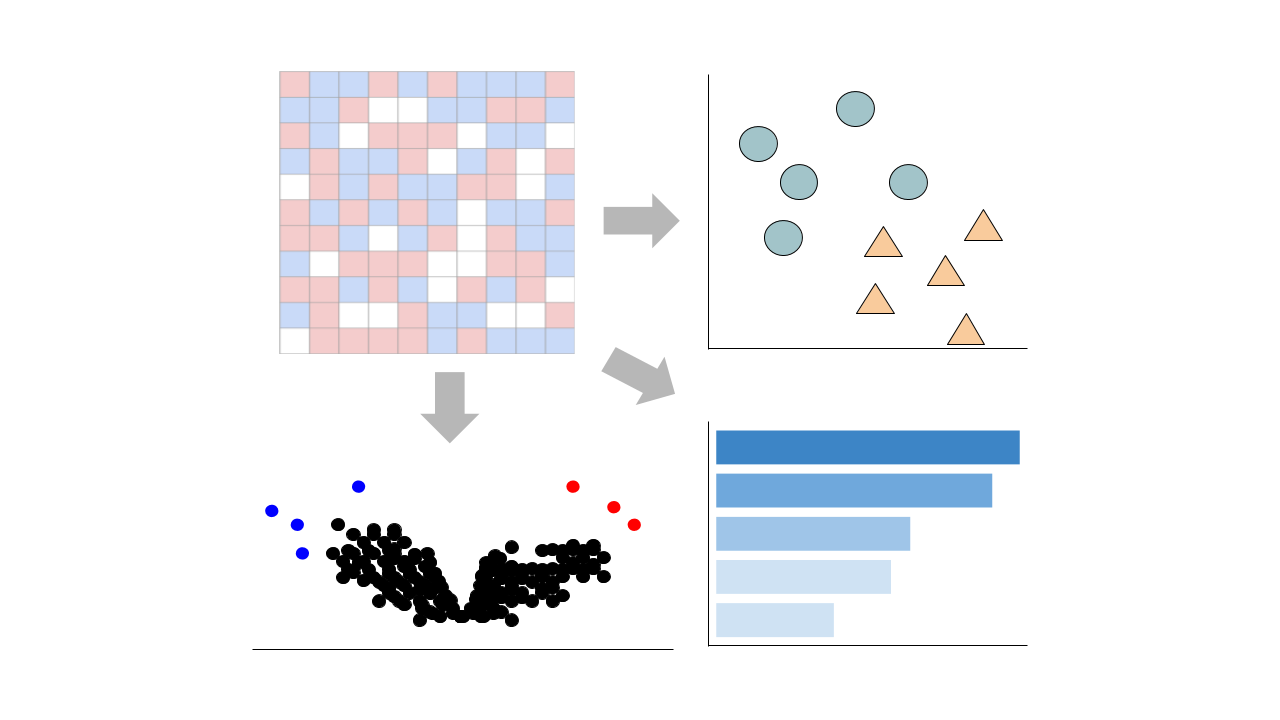
Bulk RNA-seq Appyter
This pipeline enables you to analyze and visualize your bulk RNA sequencing datasets with an array of downstream analysis and visualization tools. The pipeline includes: PCA analysis, Clustergrammer interactive heatmap, library size analysis, differential gene expression analysis, enrichment analysis, and L1000 small molecule search.