Submission Date: Aug 31, 2020
Summary: In this study, we used a productive HIV infection model, consisting of the CD4+ SupT1 T cell line infected with a VSV-G pseudotyped HIVeGFP-based vector, to explore the transcriptomic and m6A/m5C epitranscriptomic lansdcape upon HIV infection, and compare it to mock-treated cells at 12h, 24h, and 36h post infection.
GEO Accession ID: GSE157190
PMID: No Pubmed ID
Select conditions below to toggle them from the plot:
| GROUP | CONDITION | SAMPLES |
|---|---|---|
| Infection |
GSM4758531
|
|
|
GSM4758527
|
||
|
GSM4758528
|
||
|
GSM4758529
|
||
|
GSM4758530
|
||
|
GSM4758532
|
Submission Date: Aug 31, 2020
Summary: In this study, we used a productive HIV infection model, consisting of the CD4+ SupT1 T cell line infected with a VSV-G pseudotyped HIVeGFP-based vector, to explore the transcriptomic and m6A/m5C epitranscriptomic lansdcape upon HIV infection, and compare it to mock-treated cells at 12h, 24h, and 36h post infection.
GEO Accession ID: GSE157190
PMID: No Pubmed ID
Select conditions:
Control Condition
Perturbation Condition
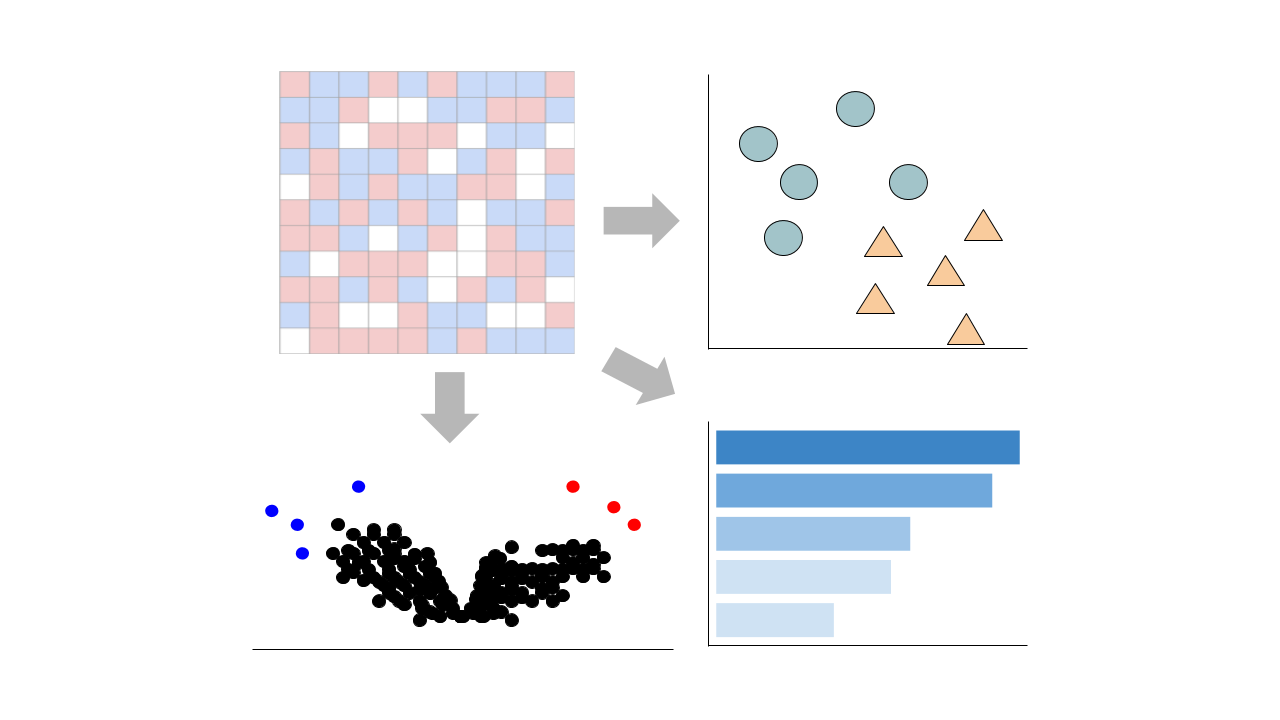
This pipeline enables you to analyze and visualize your bulk RNA sequencing datasets with an array of downstream analysis and visualization tools. The pipeline includes: PCA analysis, Clustergrammer interactive heatmap, library size analysis, differential gene expression analysis, enrichment analysis, and L1000 small molecule search.