Submission Date: Jun 12, 2020
Summary: The goal of this study was to utilize CaptureSeq to be able to measure HIV-1 transcription after reversal of latency in primary cells from antiretroviral-treated HIV-1 infected individuals.
GEO Accession ID: GSE152377
PMID: No Pubmed ID
Select conditions below to toggle them from the plot:
| GROUP | CONDITION | SAMPLES |
|---|---|---|
| Non-naïve, resting CD4+ T cells |
GSM4613722 GSM4613728 GSM4613734 GSM4613740 GSM4613746 GSM4613752 GSM4613758
|
|
|
GSM4613725 GSM4613731 GSM4613737 GSM4613743 GSM4613749 GSM4613755 GSM4613761
|
||
|
GSM4613721 GSM4613727 GSM4613733 GSM4613739 GSM4613745 GSM4613751 GSM4613757
|
||
|
GSM4613723 GSM4613729 GSM4613735 GSM4613741 GSM4613747 GSM4613753 GSM4613759
|
||
|
GSM4613724 GSM4613730 GSM4613736 GSM4613742 GSM4613748 GSM4613754 GSM4613760
|
||
|
GSM4613726 GSM4613732 GSM4613738 GSM4613744 GSM4613750 GSM4613756 GSM4613762
|
Submission Date: Jun 12, 2020
Summary: The goal of this study was to utilize CaptureSeq to be able to measure HIV-1 transcription after reversal of latency in primary cells from antiretroviral-treated HIV-1 infected individuals.
GEO Accession ID: GSE152377
PMID: No Pubmed ID
Select conditions:
Control Condition
Perturbation Condition
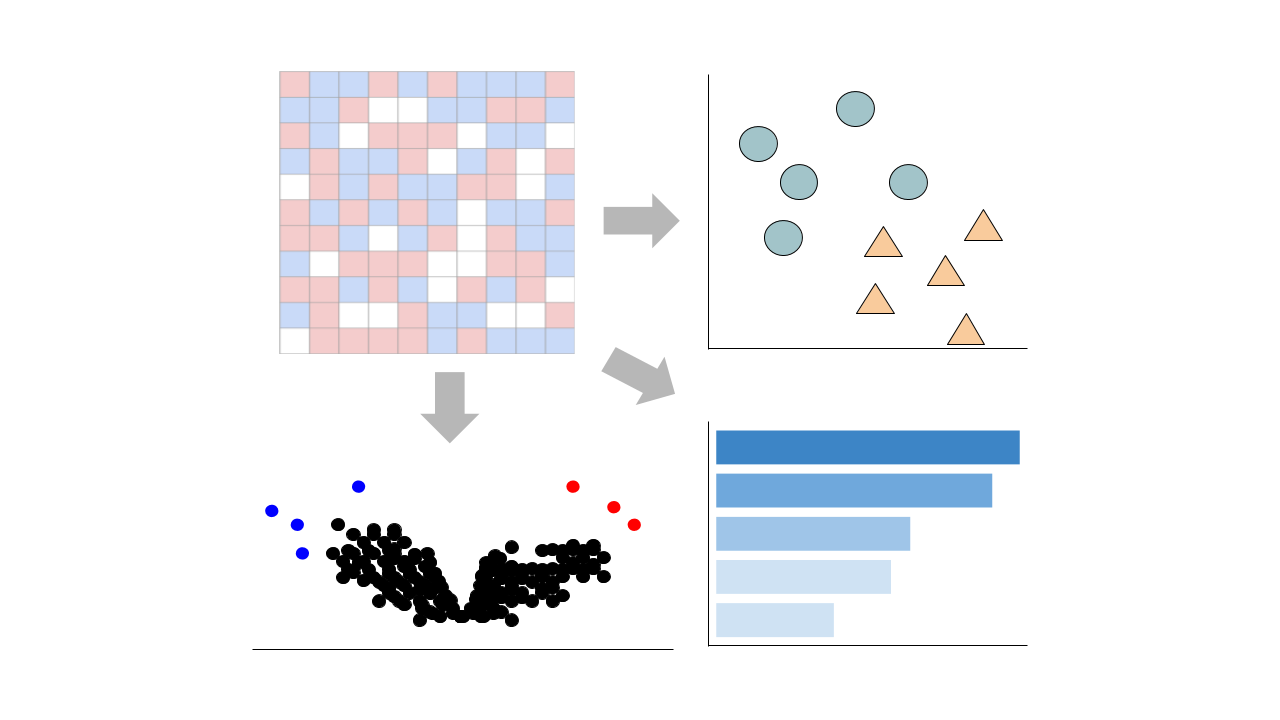
This pipeline enables you to analyze and visualize your bulk RNA sequencing datasets with an array of downstream analysis and visualization tools. The pipeline includes: PCA analysis, Clustergrammer interactive heatmap, library size analysis, differential gene expression analysis, enrichment analysis, and L1000 small molecule search.